Comparison of Static Analysis Tools – A DAR Report!

Its been quite some time since I last wrote a blog post, and here I am back at it again! I’m going to forgive myself for that, because after all, its my first time in Europe and things had to settle down! Loving it at trivago!

We are off to an adventure here to select a tool that would best suit the need for a static code analysis tool to be used for validating the code quality of the project that I am currently working on. At the end of it all, we need a tool that compliments Kotlin and ReactJS with Typescript. I have gone with the Weighted Sum Model to rank the tools according to the selected criteria in order to arrive at a result (Power of proof matters :)). So let’s get started!!

Points Considered:

Here’s a list of requirements that I considered as the influence factors in the selection of this static analysis tool.

  • Ability to analyse the code quality of Kotlin, React JS and its Typescript files.
  • Ability to add rules on demand.
  • Active support.
  • Support for open source tools and linters.
  • Integration with coverage reporting tools.
  • Slack integration.
  • Jira integration.
  • Visual representation.
  • Pricing/Free Open source

So here’s the list of contenders going at it and I have chosen to go with the “most known” static code analysis tools out there in the market.

For Kotlin, detekt and ktlint have been evaluated along with the possibilities of providing a better visual experience on the results.

Sonarqube:

A powerful static analysis tool that is also open source. Supports over 26 languages and is capable of not just finding bugs in the code, but also coding rules, test coverage, duplications, API documentation, complexity and much more visually represented through a single dashboard. It also provides moment in time snapshot of the code quality as well as the trends of lagging or leading. The default profiles for specific languages could be customised to add new rules and to remove rules that may not suit the flow of a project. There’s also a comprehensive set of metrics that could be used in tracking the quality of the code. It can also be integrated into Slack, Jacoco and Jira, providing a complete coverage on the development life cycle. Provides active support through its GitHub page and community forum.

Criteria Weight Points Score
Ability to analyse the code quality of Kotlin, React JS and its Typescript files 30 30 30
Ability to add rules on demand 15 15 15
Support for open source tools and linters 10 10 10
Visual representation 10 8 8
Pricing/Free Open source 9 9 9
Active support 8 7 7
Integration with coverage reporting tools 6 6 6
Slack integration 6 6 6
Jira integration 6 6 6
Total 97

https://www.sonarqube.org/index/clean-code.png

97 is a score to beat! let’s see what the others have in store for us!

Code Climate:

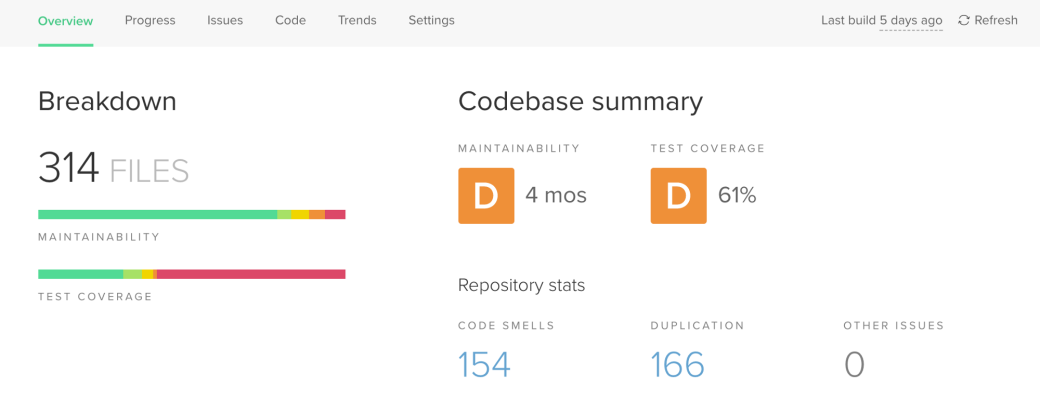
A popular code quality tool that identifies potential code errors, security vulnerabilities and provides quantitative and qualitative metrics tracking progress over code based trends. Provides an effective user interface that makes the provided figures and charts easier to understand. Test coverage and maintainability are graded from A to F based on various measures and percentages. There have been instances logged where lots of false positives are shown when the analysis is run for the 1st time, making it not-so-accurate. The metrics applicable are also related to complexity and duplicated code. It can also report code coverage in a comprehensive form of per-file.  It also provides integration with Slack and Jira, though issues have been reported on its compatibility with Jacoco. Support is limited as it is provided as requests through their website.

Criteria Weight Score Comments
Ability to analyse the code quality of Kotlin, React JS and its Typescript files 30 30
Ability to add rules on demand 15 10 Checks, plugins and patterns can be added or removed through a yml or json config file.
Support for open source tools and linters 10 10 css, scss, sass etc. available.
Visual representation 10 8
Pricing/Free Open source 9 0 Paid/Enterprise versions available.
Active support 8 3 Support available through a request form in the website.
Integration with coverage reporting tools 6 4 Coverage tools of popular languages are available. Issues raised over functionality with Jacoco.
Slack integration 6 6 6
Jira integration 6 6 6
Total 77

https://frozencloud.files.wordpress.com/2018/07/af548-1b1c6s5dxaroqrmrwmej4va.png

77 isn’t bad. May be the next one will do better!

Codebeat:

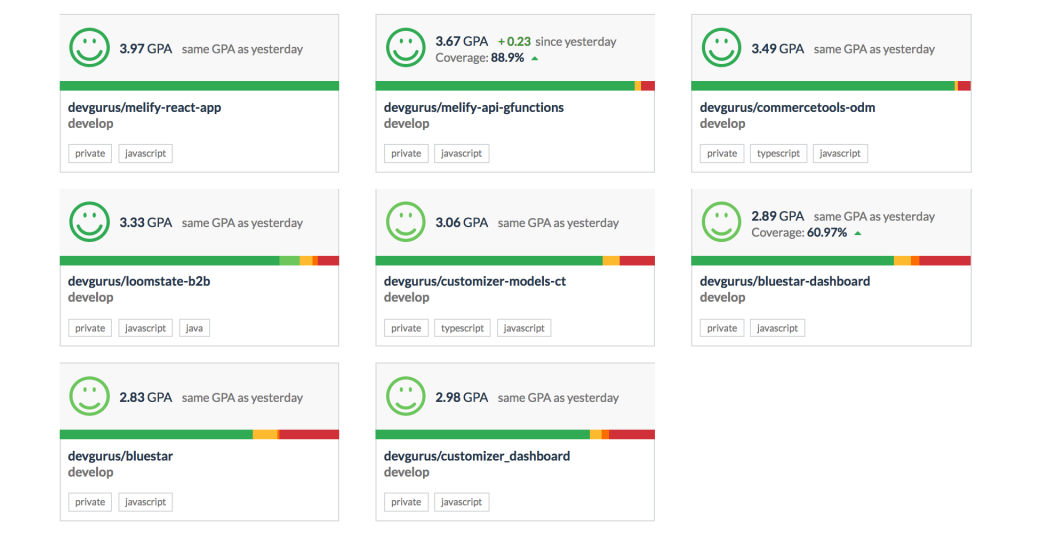
A code quality tool that grades the projects similar to Code Climate, but using a 4.0 scale system instead of A-F. Provides a comprehensive user interface that is smooth to use. Tool happens to be more accurate than Code Climate as it is even capable of differentiating similar code to identical code. It also contains a section where it lists down the top 5 issues that affects the code quality in a project. Main drawback for the tool comes from its inability to allow adding of more plugins or rules, leaving the users to stick to the default provided ones. Comes in free for public repositories and paid version for private repositories (Cheaper than Code Climate). Supports integration with Slack and Jira though there it does not accept the output files from Jacoco. Support is available through an online forum though it doesn’t seem to be active.

Criteria Weight Score Comments
Ability to analyse the code quality of Kotlin, React JS and its Typescript files 30 30
Ability to add rules on demand 15 0 Works with default rules.
Support for open source tools and linters 10 0 Doesn’t provide any linters for CSS, SCSS etc.
Visual representation 10 8
Pricing/Free Open source 9 3 Free only for public repositories.
Active support 8 4 Online forum available but not actively responded.
Integration with coverage reporting tools 6 3 Doesn’t support integration with Jacoco
Slack integration 6 6
Jira integration 6 6
Total 60

https://frozencloud.files.wordpress.com/2018/07/6a3ac-1uwwfpuvpejsispcpd2phsg.png

Expected much better from this one, still 60 is a good score!

Codacy:

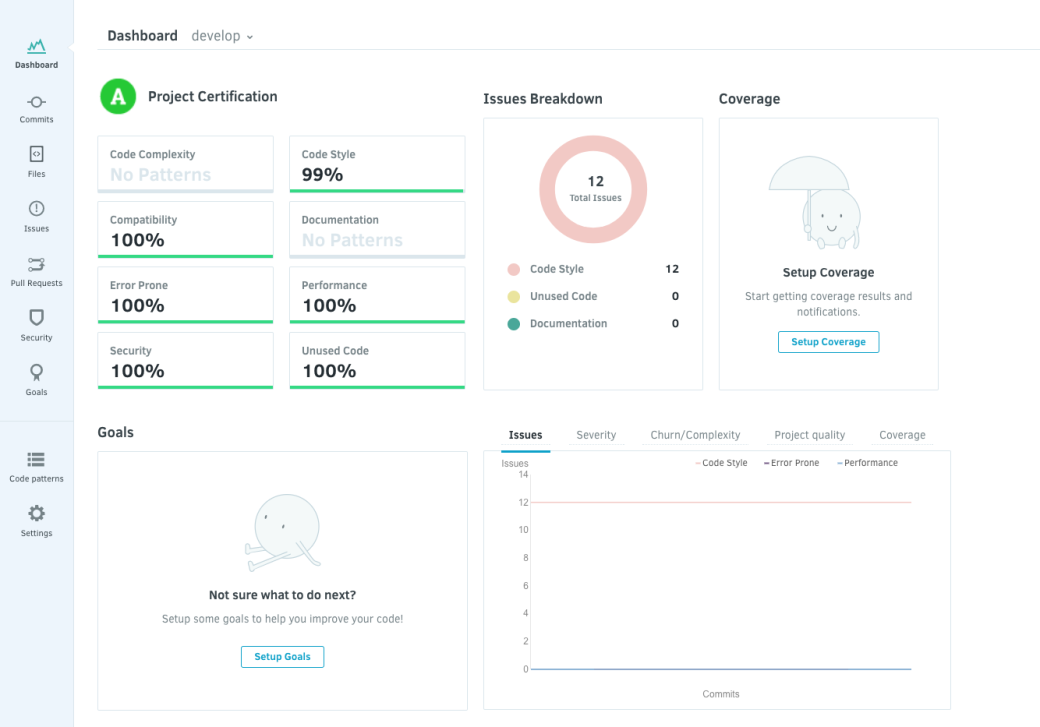
The last tool to be considered, having a great user interface that is clean and easy on the eyes. Contains a popular user base with companies such as Adobe and Paypal. Provides more metrics compared to Code Client and Codebeat, in the form of code complexity, compatibility, error-prone, security etc. Allows defining goals per file or category and helps providing steps to tackle the issues and meet the goals. Capability to measure code quality for Javascript seems to be lesser compared to other tools. Similar to Codebeat, this also provides a free version for public repositories while different paid plans are provided for private repositories. Integration with Slack, Jacoco and Jira are available. Support is available through requests submitted through the website.

Criteria Weight Score Comments
Ability to analyse the code quality of Kotlin, React JS and its Typescript files 30 30
Ability to add rules on demand 15 10 Allows adding custom extensions and patterns.
Support for open source tools and linters 10 10 Community linters are available
Visual representation 10 10
Pricing/Free Open source 9 3 Free only for public repositories.
Active support 8 3 Requests submitted online.
Integration with coverage reporting tools 6 6 Doesn’t support integration with Jacoco
Slack integration 6 6
Jira integration 6 6
Total 81

https://frozencloud.files.wordpress.com/2018/07/eff4f-1ibalqiz-z3bv5ldtzla7dq.png

81 was a close call! but we know who stood out!

Based on the rankings resulting from the weighted sum model, Sonarqube seems to be the best option having configurable quality profiles, risk based views, comprehensive reports, custom rules, community support and a downloadable free version that we can setup ourselves.

Static analysis plan for Kotlin:

ktlint and detekt are two of the most popular static analysis tools for Kotlin.

ktlint:

  • Provides no configuration options, as it enforces the official code style from kotlinlang.org and Android Kotlin Style Guide.
  • Contains a built in formatter.
  • Provides command line interface reports or in XML format.
  • More of a CheckStyle for Kotlin, and we still need to have Lint for all other checks.

detekt:

  • Highly configurable with custom rules.
  • Contains checks for more code smells compared to ktlint.
  • Analysis can be run both at build.gradle file level and command line interface level.
  • Allows to add more extensions.

detekt contains the edge over ktlint having the capability to find more code smells, is updated quite often and contains lots of configuration options. detekt could also be integrated to Sonarqube with https://github.com/arturbosch/sonar-kotlin. This allows the configurations to be done through sonarqube user interface and provides the reports in an easily readble format through the sonarqube dashboard itself.

In conclusion, Sonarqube is what I’m going ahead, with detekt, for a comprehensive visual representation of the issues and for providing more configuration options (What’s more, both happen to be free! 😀 ).

Aaand so that brings us to a close! Oh on another note, life in Europe has been quite a change, especially for someone who couldn’t even make tea back at home! But then again, here I am making biriyanis for Muslim friends ^_^


Getting Started With IBM Watson IoT Platform

So this Thursday turned out to be a quite a productive day thanks to the unexpected invitation to the IBM Analytics workshop sponsored by my company. Mr. Rajesh M Jeyapaul and Mani Madhukar from IBM India conducted well composed sessions on IBM Watson IoT platform and Analytics platform. The session consisted of two parts, where the 1st part focused on creating your own IoT application using the IBM Watson IoT Platform while  the 2nd part was about analyzing data with Data Science Experience (DSX). In this article I’ll be writing about how to get your hands dirty with Watson IoT platform to create your own IoT application and store the data into IBM Cloud.

XaaS consists of several cloud computing models in which IBM Cloud combines the PaaS (Platform as a Service) and IaaS (Infrastructure as a Service) models through a catalog of cloud services to assist in rapid implementation of a wide variety of business applications. With IBM Cloud in the picture, you are relieved off the concerns of making your own heavy investments to run and test your app. From development sandboxes to distributed production environments, IBM Cloud offers all kinds of services, containers and tools you might need. So whether its deployment, security or expansion, none if it is of your concern now!

In this tutorial, let me get you started with the Internet of Things Platform Starter boilerplate which is one of several boiler plates, available in the IBM Cloud dashboard.

1. The Dashboard of Possibilities

Load the IBM Cloud dashboard and create yourself a free account.  Once you login to the dashboard, click on the Catalog menu item at the top. You might get the “Lite” filter applied on the search box, which indicates the boiler plates that could be tried for free with no restrictions on the period of usage. Remove the filter to witness the wide variety of projects that could be created without breaking a sweat to setup the environment. From bare metal servers to block chain services, possibilities are countless! Clicking on the boiler plate would provide you with a brief description which is pretty much self explanatory. Once you are done exploring, click on Internet of Things Platform Starter to create our project. This would create you a sample NodeJS application which could be used to collect and store data in the cloud.

Here’s a sneak peek into the architectural diagram in concern.

Capture.PNG

Credits: Kashyap Ravichandran and Rajesh K Jeyapaul

2. Setting up The Project

Enter a name for your project in the App Name text box and choose a region to deploy your application in. Let me specify the name as mayooran-iot-test. and region to be US South.

NOTE: App Name has to be UNIQUE!

Once you fill these two in, rest of the text box values would be generated for you. So now your form should look something like this.

Capture

As you scroll down you could see the technologies involved with this boiler plate. We will be presented with platform consisting of Node JS SDK, Watson IoT Platform (MQ Broker) and Cloudant NoSQL for database. Of course we have chosen the Lite plan here, which is the free plan that lets you play around with the projects and services. Without further ado, click on the Create button. Now you will be redirected to your project page where you could see the state of your environment as shown below.

Capture

Once everything is set to go, you would see the state change to started/awake! (Give it some time folks, takes a couple of minutes!) Now visit the dashboard home page and you should your project listed. Below is how mine looks.

Capture

Under Cloud Foundry Services, click on the Internet of Things Platform under Service Offering column(mayooran-iot-test-iotf-service in my case). Now you’ll be presented with the Watson IoT platform Service page as shown below. Click on Launch to kick things off!

Capture.PNG

3. Creating a Device And Fetching Data

Upon clicking Launch on the above image, you’ll be landing on the page shown below.

Capture.PNG

Click on the highlighted Devices icon to create a new device and connect it to the platform. On this Devices page, click on Device Types from the menu and click on +Add Device Type button as shown below.

Capture.PNG

On the device type creation form, leave the Type as Device. Enter a Name for the device and a Description if you like and click Next.  Just to be sure here’s what I have now.

Capture

On the Device Information form you get now, you can leave the information empty and click Done. Upon successful addition you should now see the page shown below. Click on Register Devices.

Capture

On the device creation form, specify a Device ID and click Next.

Capture

Again you may leave the Device Information form empty as shown below and click Next.

Capture.PNG

On the Device Security form, specify an Authentication Token which would be used when establishing connection from the device and click Next.

Capture.PNG

click Done from the device information page as shown below.

Capture.PNG

You’ll now be directed to the Device Drilldown page where you can check the Device Credentials, Connection Information, Recent Events etc. Make a note of the credentials, as you will need this when connecting your device to the cloud.

Capture.PNG

4. Generating Data From Your Mobile Device

Now let us use the mobile app Lyfas to generate the pulse data which will be storing in IBM Cloud. If you are not in possession of an Android mobile, use the IoT Sensor Simulator to generate your data. Android users, follow the below steps to capture pulse data from your mobile and stream.

Step I : Open the installed Lyfas application. Enter a unique ID when prompted for (Your mobile number would do).

Capture.PNG

Step II:  Click on the menu, and select Settings.

Capture.PNG

Step III: Under Blumix Settings specify the credentials you had noted down when we were setting up the device earlier, and click Save. Some other options are using an API key or using a MQTT broker. Below is how it would look with respect to the settings I had specified.

Screenshot_20171201-204223

Step IV: Now in order to capture your pulse data, click on Start Pulse from the drop down as shown below.

Capture.PNG

Step V: Then hold your finger on the flash light to capture your pulse data. Perform this as gentle as possible, to avoid skin burns. Now you should see the data being captured and a graph drawn on the screen.

Step VI: Now click on Stream toggle to start streaming the captured pulse data. This will ensure that the captured data is pushed to the IBM Watson IoT Cloud.

Capture

NOTE: If you are unable to see the streaming data, there could be a TLS authentication issue. In order to fix this temporarily, you can set the Security Level to TLS Optional. This could be set by clicking on the Settings icon in the dashboard, and selecting TLS Optional from the drop down menu for Security Level.

Now you if you go back to the IBM Watson IoT platform dashboard and select the device, you could see the Recent Events menu. Under this, you could find the pulse sensor data that was streamed from your mobile device!

Capture.PNG

If you click on the State tab, you could find the most recent data that was transmitted.

Capture.PNG

5. Node-RED In Action

Now that we’ve got the data into the cloud, we could play around with the node-red run time we have been provided. Let’s now go back to your bluemix dashboard, and click on the Node-RED url as shown below.

Capture.PNG

When the page loads, click on Next as shown below.

Capture

On the second window, you can disable the security settings (As this a simple demo) as shown below and click Next.

Capture

Now click on Finish on the final window to launch the node-red page. Then click go to your Node-RED flow editor as shown below.

Capture.PNG

Node-RED allows a visual programming approach to build IoT applications using a simple flow based approach. If you are interested in learning the basics of Node-RED, the documentation here provides you with every information you need.

On the flow editor, double click on IBM Iot App In to configure the device from which we will be gathering the input. Fill in the form with the Device Type and Device Id as shown below. You may leave the rest of the details with the default values. and click Done. Now Click the Deploy button at the top of the editor to complete deployment of the flow.

Capture.PNG

Now when you start the cam pulse again and start streaming data from your mobile app, you will see the live data appearing on the debug tab as shown below.

Capture.PNG

Now let us store this data in the cloudant database instance we were provided with. Scroll down on the list of nodes available at the left side of the editor and choose cloudant out node from the storage category as shown below.

Capture.PNG

Drag and drop this node on to the flow editor, and double click on it to start configuring. Service will be automatically loaded for you hence you just need to specify the Database as shown below.

Capture.PNG

Click on Done and then click Deploy.

Now go back to your dashboard and click on the Cloudant NoSQL DB instance as shown below.

Capture.PNG

On the Service Details page, click on Launch.

Now you could see the database instance created as below. Publish some data again and you could see the data flow into mydb instance.

Capture.PNG

Click on the mydb instance, to view the data that has been stored.

Capture.PNG

Well that’s it folks! You’ve stored your sensor data in a cloudant database instance through a Node-RED editor with minimal connection configurations and did you even bother installing anything or setting up any software? Well that’s what IBM Cloud brings to the picture. All you ever did connect the mobile app that publishes sensor data and just created a flow consisting of two nodes to get into the cloudant database.

I hope that would’ve given you a teaser to the main movie called IBM Cloud and its endless possibilities. Once you have figured out these steps, it shouldn’t take you more than 10-15 minutes! So I’ll wrap up the capabilities of IBM Watson IoT platform and in the next tutorial let’s see how we can use the analytic capabilities of IBM Watson. I’ll leave you here with a teaser for that! 🙂

Entire credits go to Mr. Rajesh K Jeyapaul and Mani Madhukar from IBM India for conducting such an informative and productive session in such a limited time, ensuring total participation!!


Getting Started with Selenium Grid

What and Why!

It’s been a while since I blogged anything and here I am about to put my Selenium Grid experience to the vault. If your problem is to either save execution time on a large test suite or is to run several test cases in parallel on different platforms, then Selenium Grid is the answer. Selenium Grid allows you to test any combination of operating system running any browser, in parallel of course.

The Architecture

Selenium Grid is purely a network of hubs and their relevant nodes. A hub would work as the central point establishing control over all the connected nodes. This is where all the scripting would be done. A node on the other hand is any PC on which your test cases would get executed. These nodes could be a Windows machine with a Chrome, a Linux machine with a Firefox, Mac with a Safari or even an Android device. Now, having Android doesn’t mean that we could execute test cases of a mobile application! This rather means that we can execute our web application on a mobile browser. You can find a descriptive image of the architecture at toolsqa.com

Throughout this tutorial we’ll be using Selenium Grid  2.0 which has the remote control bundled with the Selenium Server jar file itself. Therefore we’ll be needing only the server jar file to host the grid. Using 2.0 also means that we need not to have an Apache Ant installation as required by 1.0.

First of all let us download and setup the Chrome driver for Google Chrome and Gecko driver for Firefox. So in our example we will be launching our tests on both Google Chrome and Firefox, in parallel! Now that you’ve got a basic idea, let us now get into the setup process!

Setting Up the Grid

Setting up the Web Drivers

In order to launch browsers to load our web application, we first need to setup the relevant web drivers. These web drivers are separate executables that allow us to control the relevant browsers. Since we’ll be running our test suite in this tutorial on both Chrome and Firefox, we’ll be needing the Chrome Driver executable and Gecko Driver executable.

Let us first setup the Chrome driver by following the below mentioned commands. In the below steps we’ll be downloading the Chrome driver, specifying executable permission to the downloaded executable and moving it to the usr/local/share directory. We’ll then be creating symbolic links to the usr/local/bin and usr/bin directories.

Now its time to setup the Gecko driver. Steps here are exactly similar to the ones followed for the Chrome Driver.

Getting the Grid up and running!

Okay now that we got the client drivers covered, let us now get the Selenium server hub up and running. As mentioned earlier, this is where all your scripting would be done at.

  • Download the latest version of Selenium Server.
  • Open a terminal and navigate to the downloaded location.
  • Execute the command shown below to run the server.

java -jar selenium-server-standalone-3.5.3.jar -role hub

Up on successful execution, your terminal would look something like this.

Capture.PNG

Execution of the above command would start a Jetty server on port 4444. You could pass the parameter “-port” to specify a custom port number of your choice. Now open a browser and visit the page http://localhost:4444/grid/console to verify that server is running without any issues. Your page should look something like this.

Screenshot from 2017-09-23 19-43-16.png

Next up is to start the node! Again, this would be the computer on which the browser would be launched and your tests would get executed. Follow the below mentioned steps to register an instance of the node on the hub that we set up in the above steps.

  • Download the latest version of Selenium driver in the node machines as well.
  • Open a terminal and execute the command given below to run the server on the node machine. Note that your role has now changed to “node”.

java -jar selenium-server-standalone-3.5.3.jar -role node -hub http://<IP of the Hub machine>:4444/grid/register

URL of the hub that is used in the above command would be the one displayed in the terminal for hub that we opened in the earlier step. In that terminal, find the “Nodes should register to” output as shown below.

You could also specify the Chrome driver location with the Selenium server command itself, if you haven’t created a Symbolic link to it. This is a popular option among Windows users as well. So your command to run the node would now look something like this.

java -jar -Dwebdriver.Chrome.driver=<location of the Chrome driver executable> selenium-server-standalone-3.5.3.jar -role node -hub http://<IP of the Hub machine>:4444/grid/register

Up on successful completion of registering the node at the hub your hub terminal would now show the entry shown below. Note that both the hub and node IP addresses are the same for me as I am running both of them in the same machine.

Capture.PNG

Visiting the URL http://localhost:4444/grid/console in the node machine would now show you a page similar to what has been shown below.

Screenshot from 2017-09-23 19-36-46

The above page shows you the information on how many nodes have got registered (Only 1 node in my case) and how many instances of different browsers could be opened at one go.

Well guess what, that’s all we had to do to setup our Selenium Grid!

Our Grid in action!

Let us now run a couple of tests in parallel and see our grid in action. For this purpose I am going to be using TestNG with Eclipse to write the test suite. Ignore the below steps if you already have an Eclipse with TestNG plugin installed.

Setting up Eclipse with TestNG

  • Download the latest version of Eclipse.
  • Open Eclipse and select a directory to be used as the work space for our project (If you are not familiar with the concept of work space, read through this).
  • Find TestNG plugin in the Eclipse Market place and drag and drop the “Install” button into your Eclipse.
  • Eclipse will now launch a new window with the TestNG plugins listed. Installation steps from here on will be pretty much self explanatory. If you’re having any doubts, read through this tutorial.
  • Once the plugin has been installed, restart your Eclipse software.

Creating the test suite using TestNG

Now that we’ve got the development environment setup, let us now create a test suite that contains two test cases. Let’s write a test case to launch Chrome and navigate to Yahoo page. We’ll validate the title of the page to pass the test. Our next test case is going to be launching Google on a Firefox browser and verifying the title in a similar fashion. First let’s start by creating the project.

  • Go to “File” -> “New” and select “Java Project”.
  • Specify a project name and click “Finish” with other options set to their default values.
  • Expand the project and you will find the “src” directory. This is will act as the source directory where we will be creating the TestNG classes.
  • Right click on the “src” directory and then select “New” -> “Other”.
  • Find and expand “TestNG” directory, select “TestNG class” and click “Next”.
  • Click on “Browse” next to the “Source Folder” and select the “src” directory. As mentioned earlier, this folder will contain our TestNG classes.
  • Specify a package name or you can leave it blank.
  • Specify “TestBase” as the “Class name” and click “Finish”.

Bringing in Maven

Now before we get to the implementation, let us convert the created project to a Maven project. Maven is a build tool which we are going to use to manage our dependencies. By having the dependencies listed through Maven, we won’t be needed to download the required libraries manually and attach to the build path. If you’re not familiar with Maven, here’s a good tutorial.

In order to convert our project to Maven, we need to install the Maven plugin for Eclipse from the Eclipse Market Place. The installation steps would be similar to how we installed TestNG plugin. Once installed, right click on the Java project we created, go to “Configure” and select “Convert to Maven project”. Now you will see that a pom.xml file will be created. Paste the content below to your pom.xml file. All we are doing here is, adding selenium and testng libraries to our project so that we could use their methods.

<dependencies> 
 <dependency> 
   <groupid>org.seleniumhq.selenium</groupid> 
   <artifactid>selenium-java</artifactid> 
   <version>3.5.3</version> 
 </dependency>
<dependency> 
 <groupid>org.testng</groupid> 
 <artifactid>testng</artifactid> 
 <version>6.11</version> 
 <scope>test</scope> 
 </dependency>
</dependencies>

Now to the Test Suite!

Now let’s resume our implementation. TestBase.java class is where we are going to establish connection to the Hub and specify the capabilities for the platform and browser. These have been parameterized to make it configurable from outside the code and we will be retrieving the values from the TestNG xml (We’ll be creating this XML in while and this will be used to specify the test methods that we’d like to run and the order in which they should get executed.).


public class TestBase
{
//Declare ThreadLocal Driver for ThreadSafe Tests
protected ThreadLocal<RemoteWebDriver> driver = null;
//Do the test setup
@BeforeMethod
@Parameters(value={"browser","platform"})
public void setupTest (String browser, String platform) throws MalformedURLException {
//Assign driver to a ThreadLocal
driver = new ThreadLocal<>();
//Set DesiredCapabilities
DesiredCapabilities capabilities = new DesiredCapabilities();
//Set Platform
capabilities.setCapability("platform", platform);
//Set BrowserName
capabilities.setCapability("browserName", browser);
//This is where we are invoking the browser driver
driver.set(new RemoteWebDriver(new URL("http://localhost:4444/wd/hub"), capabilities));
}

public WebDriver getDriver() {
return driver.get();
}
@AfterClass
public void tearDown() throws Exception {
getDriver().quit();
}
}

Now let us create the first test to be executed. Follow the steps we followed above to create another TestNG class and call it “FirstTest”. In this class we are going to write a test to launch the Yahoo home page and verify its title. Content of this class would be as follows.


public class FirstTest extends TestBase {

@Test
public void firstTest() throws Exception {
  System.out.println("First Test Started!");
  getDriver().navigate().to("http://www.yahoo.com");
  System.out.println("First Test's Page title is: " + getDriver().getTitle());
  Assert.assertEquals("Yahoo", getDriver().getTitle());
  System.out.println("First Test Ended!");
 }
}

Now to the second test case to launch Google.com through a browser and verify its title.


public class SecondTest extends TestBase{

@Test
 public void secondTest() throws Exception {
  System.out.println("Second Test Started!");
  getDriver().navigate().to("http://www.google.com");
  System.out.println("Second Test's Page title is: " + getDriver().getTitle());
  Assert.assertEquals("Google", getDriver().getTitle());
  System.out.println("Second Test Ended!");
 }
}

Now let’s configure the TestNG xml file to contain the following configuration. Here we will be specifying the test methods to be executed and they’ll get executed in the order they’ve been specified. We will also be passing values to the parameters browser and platform that we had set up in the TestBase class. This allows us to specify on which platform and browser we need to run the relevant test cases.


<?xml version="1.0" encoding="UTF-8"?>
<!DOCTYPE suite SYSTEM "http://testng.org/testng-1.0.dtd">
<suite thread-count="5" name="Suite" parallel="tests" verbose="1">
 <test name="FirstTest">
  <parameter name="browser" value="chrome"/>
  <parameter name="platform" value="LINUX"/>
  <classes>
    <class name="FirstTest"/>
  </classes>
 </test> <!-- First Test -->
 <test name="SecondTest">
  <parameter name="browser" value="firefox"/>
  <parameter name="platform" value="LINUX"/>
  <classes>
    <class name="SecondTest"/>
  </classes>
 </test> <!-- Second Test -->
</suite> <!-- Suite -->

That’s all for the implementation. Pretty straight forward isn’t it? Now let’s run the test suite and see it in action! Right click on your TestNG.xml and select the “Run Test Suite” option. You will now see that two browsers would be opened. Chrome will be opening Yahoo.com and Firefox will be opening Google.com, both at the same time! That’s the whole point of the Grid!

What If!

In case you get an empty browser loaded or if your browser doesn’t load at all, verify that you have set up the Chrome driver and Gecko driver properly. Ensure that you are using the latest versions of the drivers as well the browsers. If not, please update your browsers to the latest versions to conform to the driver executable versions. Also if you are running the hub and node on different machines and if you run into any issues when establishing communication between them, make sure that there are no firewall issues. If not, relevant in bound and out bound rules have to be created to allow communication between the two machines.

Well that’s all folks for now. Happy gridding alright! ^_^

Diagnosing performance issues in production environments – Part II of II

It has been a hectic few days and at last I found some time to discuss the potential solutions. In the previous post we had discussed the importance of metrics and how it can help us diagnose performance issues in production environment. We were left with the question as to whether we should implement the metrics logic on our own. The simple answer is, NO. The developer community has already come up with effective libraries that provide us with a variety of features. In this post, let’s look at the potential solutions we have for C#, Java and JavaScript languages.

The project in which I had to integrate performance metrics was Java and therefore I’ll start by discussing the Java solutions first. Once we chose to go ahead with metrics, we found out that there are numerous implementations available for metrics in Java. In order to choose a library we had to make a rational decision, for which we came up with the idea of preparing a DAR report. DAR (Decision Analysis and Resolution)  is a formal process where decisions are made using a formal evaluation process after careful consideration of the identified alternatives based on established criteria. Out of the available Java libraries, we short listed a few which were obviously having the edge over the others based on popularity, features and support.

  • Java Metrics
  • Perf4J
  • JAMon
  • Java Simon

The following criteria (In the order of the weights assigned) were drawn in order to choose the best solution from the above list of available alternatives.

  • Ability to create custom counters and timers for monitoring and measuring performance of code blocks.
  • Ability to visually evaluate the performance results which would help in finding trends and patterns.
  • Free and open source software license considering the cost and ability to do modifications as and when required.
  • Ability to enable or disable the features on demand.
  • Active support provided through mailing list or by any other means.

Java Metrics (http://metrics.dropwizard.io/3.2.0/) library easily outplayed the rest with a total of 47 points based on the criteria weights assigned. It satisfies the performance counter creation requirement with features to create meters, gauges, counters, timers and health checks. Visualization requirement is satisfied through reporting capabilities with Graphite and Ganglia. Licensing requirement is fulfilled with Apache License 2.0.Active support is available through the means of an active mailing list and dedicated Stack overflow tags. Enabling or disabling the features is not provided as a result of which we chose to wrap this library and provide it on our own! Perf4J was the second best option with 34 points.

We also had a C# component which resulted in the DAR report for the list of available C# libraries. Out of all the available libraries, the following three were shortlisted for the DAR analysis.

  • Metrics.NET (etishor)
  • Statsd
  • Serilog Metrics

The same criteria were considered and Metrics.NET was chosen ahead of the rest with 50.5 points. It satisfies the performance counter creation requirement by allowing to create gauges, counters, meters, timers and histograms.Visualization requirement is satisfied through graphite reporting along with other sources of reporting such as HTTP endpoints, influx DB and elastic search. Licensing requirement is fulfilled with Apache Software License 2.0. Unlike the Java solution, Metrics.NET provides with the disabling and enabling feature through a configuration file.This means that the metrics reporting could be completely disabled when not needed. Unlike the Java solution, support is available only through the GitHub page. The second best option we had is statsd with 41.5 points. Metrics.NET could be marked down as an equivalent implementation of the Java Metrics library.

Now let us have a look at the possible JavaScript solutions that are out there.

  • metrics
  • measured
  • node-monitor
  • appmetrics

The same set of criteria were considered and “metrics” library was easily the better option compared to the rest, with 47.5 points. It satisfies the performance counter creation requirement by providing features such as meters, gauges, counters and timers.The visualization requirement has been satisfied through the reporting capability provided through Graphite. CSV and console reporting are among the other options available for reporting of the metrics. Licensing requirements are satisfied with MIT License though configuration to enable or disable the features is not provided. Support is available only through the GitHub page. This could also be identified as an equivalent implementation of the Java Metrics library.

Anyone reading through the previous post would’ve got the doubt, “What do we do when we don’t need the metrics logic to be executed?! “. Reading through the solutions in this post, you would’ve already got the answer. Most of the libraries provide enable/disable feature through configuration and even if it is not present, we could still enable/disable it by wrapping the library to implement it on our own. Another popular question would’ve been “What about the overhead?!“. We carried out a simple test based on our application’s normal flow, with and without the metrics library integration and no visible performance issues were noticed. Besides, the library websites and GitHub pages do provide the guarantee for a very minimal overhead that could simply be ignored. Okay but still, “Won’t having this code integrated into the business logic cause any confusion and reduce readability?!“. Well that is inevitable. But you could isolate the metrics code through the usage of design patterns. Observer pattern could be an option where the business logic could act as the Subject and Metrics logic could act as the Observer.

So the next time you are starting over with a new project, just consider the world of possibilities that capturing performance metrics could present you with. No more dependence on any developer for finding bottlenecks, no need to replicate the production environment data to debug and find the issue and above all, no need to squeeze your brain to think of the critical areas where it could’ve gone wrong!

Diagnosing performance issues in production environments – Part I of II

Several reasons could be put forward for the presence of performance issues in large scale, highly distributed systems. The following factors could be identified as some of the most popular concerns.

  • Lack of understanding towards the language features.
  • Lapse of concentration during development.
  • Ineffective requirements modelling techniques resulting in vague and imprecise requirements.
  • Absence of unit tests and failure to carry out boundary value analysis during the testing phase.
  • Unrealistic schedules resulting in burnouts.

The traditional way of investigating a performance issue would predictably start with log analysis where we would have to read through a bundle of log files to find the cause of the issue. Of course this could come in easy with log analysis tools such as Splunk. But then again, that depends on the quality of logs that have been used and requires the domain knowledge of the whole application to begin with. Another option that would be considered is debugging the application to locate the flaw. This would not be possible unless we could transfer the production data or simulate them at the development environment to recreate the behavior. This would as time and resource consuming as it could get. When there several developers present in a team, it would normally be difficult for someone to pin point to the critical parts of the application, subjective to the size of the team and the number of components in concern. Performance issues could turn into a nightmare if developers who have contributed to certain vital components are not there anymore.

Considering the aforementioned problems, what is the most effective way to approach this issue? Performance metrics would be that one magical element that we had missed.

Incorporating performance metrics into the code would provide you with an idea about the performance of your code and its behavior. An abnormal behavior in the code could be spotted with ease provided that the right set of metrics have been used at the right places of your code. It is important to understand that monitoring and diagnosing are different in motives. Unlike in monitoring, we need all the metrics we could possibly have when it comes to diagnosing. The following could be some of the metrics that could be integrated into your code to better understand its behavior.

  • Timers :
    Provides you with the details of the execution time of a particular code block.
  • Counters :
    Simple counters that could be incremented and decremented to keep track of the sizes of data structures being used.
  • Gauges :
    Simplest metric of them all. Return the size of something like a       cache at frequent intervals to keep an eye on its growth in size.
  • Health Checks :
    Centralize your application health on an external dependency such   as a database connection or communication channel connection.
  • Meters :
    Get the rate of events at given intervals. This could be the amount of messages being published at a given interval from a channel.

Now that we are familiar with the basic set of metrics, how do we use them at moments of crisis? How would we identify the causes of bottlenecks with the use of these? We would be required to have a proper reporting mechanism that is comprehensive enough to help us spot abnormal behaviors in the metrics that we have included. The best option would be to feed the metrics data into a graphing platform such as Graphite or Ganglia so that we could just visit the graph and point to the misbehavior and its time of occurrence. We could also feed the data into the log file we are using to keep them all at one place. So the next time something kicks the bucket, it will only be a matter of checking the metrics graph and finding a pattern. Then reading the log entries at the abnormal behavior times and values retrieved from the metrics to see where the code has fallen short. Not only can we use metrics to diagnose performance issues, we could also use them to benchmark our application performance. This would provide an expected standard level for the testers as well as the clients.

Its amazing to think of the world of possibilities that metrics provides us with. But how do we implement all this? If the plan is to implement all this on our own, that would result in a separate side project with the need for additional resources and effort. Apart from that, there would be concerns about running the metrics code in the production environment. Should we need the capability to use the metrics code as and when required? Even if that’s the plan, wouldn’t integrating the metrics code into your business logic reduce readability and cause confusions? But then again, most of the problems in the world of programming have already been resolved. Its only a matter of finding the right solution and contriving it to our own needs! We will discuss about the list of available solutions for this in the next post!

Creating a MQTT client using Javascript for NodeJS and browser

Recently I came across this requirement where I had to implement a MQTT client using Javascript for NodeJS and browser. It is easier than you think it is using the npm mqtt package . Latest release till date is 1.11.2 but if you run into any errors while using browserify on the created client, then I advice switching back to 1.8 version because of a dependency issue with the dependency mqtt-packet . Install the mqtt dependency using


npm install mqtt --save

You could then require the module as shown below.


var mqtt    = require('mqtt');

Create a simple client passing in the MqttOptions object. Information on the properties has been given on the git hub page but it is very basic. If you’re someone new to MQTT, you’re better off reading the explanation provided in HiveMQ essentials series.

Create a simple MqttOptions as shown below passing in the basic parameters.


var mqttOptions = {
clientId: 'f1b948b7-2114-4c8e-962f-d15f4cf90abe',
protocolId: 'MQTT',
protocolVersion: 4,
keepalive: 10000,
clean: false,
reconnectPeriod: '1000',
will: willMessage
};

The above would require a will message object which would be used to notify connected clients about another disgracefully disconnected client. Creating it would be done as follows.


var willMessage = {
topic: 'WillMessage',
payload: 'This is the last will message',
qos: 2,
retain: true
};

Use the above created MqttOptions object to establish the connection to the Mosquitto broker.


var client = mqtt.connect("mqtt//:localhost:1883", mqttOptions);

URL could be one of  ‘mqtt’, ‘mqtts’, ‘tcp’, ‘tls’, ‘ws’, or ‘wss’. I’ll cover establishing secure connection methods in the up coming tutorials.

Once the connection has been established you can publish and subscribe to messages as shown below.


client.subscribe('someTopic');

client.publish('someTopic','someMessage');

You could also hook onto the following callbacks and implement logic accordingly.

  • connect – function(connack) {}
  • reconnect – function() {}
  • close – function() {}
  • offline – function() {}
  • error- function(error) {}
  • message – (topic, message, packet) {}
  • packetsend – function(packet) {}
  • packetreceive – function(packet) {}

Below is an example implementation of the connect call back mentioned above.


client.on('connect', function () {

console.log('client connected');

});

client.on('message', function (topic, message) {

console.log(message.toString());

});

Auto reconnect when failing to connect to the server has already been implemented through the library and you could see this by hooking onto the ‘reconnect’ method. I have come across an abnormal behavior where the previously subscribed topics have been lost after successfully connecting on a reconnect, though I have set clean property in MqttOptions object to false. Check whether you encounter this issue and if so, keep track of the subscribed topics in a list and subscribe to them again in the reconnect callback.

You could terminate the client using client.disconnect method.

I hope that would have given a clear idea as to how to create a MQTT client using Javascript for NodeJS. You could use browserify to create a version of the file that could be used in browsers. As I mentioned at the start of this post, if you encounter an errors while browserifying the file, always switch back to the 1.8 version in which it works fine.

So I’ll wind up this post for here now. I’ll add another post on how to establish ssl/tls and wss connections through the clients! 🙂

Getting started with MQTT and Mosquitto

What it is and why you would need it

If you’re looking for a light weight messaging protocol then MQTT would an answer you could consider. It follows the publish-subscribe mechanism but of course you could tweak it to suit one-one messaging as well. MQTT has been quite a trending topic these days with the evolution of the Internet of Things. Objectives of this protocol is to have high reliability through assurance of delivery while playing with minimum network bandwidth. Clear evidence of this being achievable through the protocol has been visible through the usage of it in IOT where sensors, mobile devices and embedded computers use it for messaging purposes.

Recently I came across the need for a messaging bus where we first came up with the implementation of our own messaging bus. This had taken about 5-7 milliseconds for end-to-end delivery of messages. Later on we came across MQTT and it took only one millisecond for end-to-end delivery of messages. It could also support websocket connections which helped us remove our own implementation of a websocket client from the project as well. FAQ page of MQTT would provide you with answers for most of the questions that would’ve risen in you by now!

Mosquitto – The messaging broker

The messaging broker we had used is Mosquitto which is an open source project from Eclipse that implements the MQTT protocols 3.1 and 3.1.1.

You could download the latest version of Mosquitto from here . Simply run the mosquitto executable from the downloaded folder and you’re good to go. You could enable verbose logging with the -v parameter and configurations could be loaded from a specific file through the usage of -c parameter. Read more about the configurations from here . Running the mosquitto executable would create a non-secure connection through the default port 1883 and secure encrypted connections could network connections and authentications could be established through SSL. Download the latest version of open SSL and copy the libeay32.dll, ssleay32.dll and libssl32.dll files to your mosquitto installation folder. Apart from that, download the pthreadvc2.dll and place that in the mosquitto installation folder as well.

In order to configure the server for certificate authentication, follow these steps and generate a certificate authority certificate and key, server key and a server certificate by creating a CSR and signing it with your CA key. Place the below entries into the configuration file and restart the mosquitto broker.


listener 8883
cafile certs/ca.crt
certfile certs/server.crt
keyfile certs/server.key
require_certificate true

Default port 8883 has been used in this scenario and setting the require_certificate to true would require the client to provide a valid certificate in order to establish the connection. This could be set to false if clients are not expected to be authenticated through their certificates.

Websocket support also needs to be explicitly enabled. This requires libwebsockets and a step by step instruction set on how to achieve this could be found here . You could also enable SSL authentication through websockets and a sample configuration would look like shown below.

listener 9002 127.0.0.1
protocol websockets
cafile certs/ca.crt
certfile certs/server.crt
keyfile certs/server.key
require_certificate true

That’s it and you have setup your mosquitto with additional websocket and SSL support!

MQTT could be the answer for any of your requirements of a lightweight messaging protocol even if it doesn’t involve IOT just like in my case! Hope this would’ve given an idea of what MQTT is and how to setup Eclipse’s Mosquitto broker. Soon I’ll follow this up with tutorials on create clients using Java and NodeJS. Happy messaging folks! 🙂

Getting the progress percentage from a burn bootstrapper installer

One of the basic requirements from an installer created using burn bootstrapper would be to display the progress percentage. I had a tough time finding a proper solution to this as most of the solutions on the internet didn’t work properly while displaying the uninstall percentage. So I have put together variety of things I had searched into one single solution.  So let’s get started!

In order to display the progress bar, we need to handle two events. First of which is the CacheAcquireProgress. This will give you the percentage related to caching the package. Next is the ExecuteProgress percentage, which will give you the percentage for the executed packages. Now most of the sites had specified to add both of the values and divide it by two. This cannot be done as some actions will not be having a cache phase. So in order to find the denominator,  we need to use the OnApplyBegin in v4 of WiX and OnApplyPhaseCount in versions below 4. Since there hasn’t been a stable v4 release yet, I will give you sample of how its done in versions under v4 with the OnApplyPhaseCount method.

Create a view for the percentage bar as shown below.


<WrapPanel Margin="10" >
<Label VerticalAlignment="Center">Progress:</Label>
<Label Content="{Binding Progress}" />
<ProgressBar Width="200"
Height="30"
Value="{Binding Progress}"
Minimum="0"
Maximum="100" />
</WrapPanel>

Now let’s bind this to a property called progress.


private int progress;
public int Progress

{

get
{
return this.progress;
}
set
{
this.progress = value;
this.RaisePropertyChanged(() => this.Progress);
}
}

Now let’s add the event handlers for the CacheAcquireProgress and ExecuteProgress events.


private int cacheProgress;
private int executeProgress;

private int phaseCount;

this.Bootstrapper.CacheAcquireProgress += (sender, args);
{
this.cacheProgress = args.OverallPercentage;
this.Progress = (this.cacheProgress + this.executeProgress) / phaseCount;
};
this.Bootstrapper.ExecuteProgress += (sender, args);
{
this.executeProgress = args.OverallPercentage;
this.Progress = (this.cacheProgress + this.executeProgress) / phaseCount;
};

We then get the phase count by hooking onto the ApplyPhaseCount method as shown below.

WixBA.Model.Bootstrapper.ApplyPhaseCount += this.ApplyPhaseCount;

private void ApplyPhaseCount(object sender, ApplyPhaseCountArgs e)
{
    this.phaseCount= e.PhaseCount;
} 

This would give you the perfect progress percentage for your custom installer!

Passing install path as an argument to burn bootstrapper

I had to add this extra little thing to my Burn bootstrapper EXE where I had to enable the user to pass the installation location as a command line argument. So here is how to do it.

First of all in your chain element of the bootstrapper project’s bundle.wxs, add the MsiProperty element which would allow us to pass value to a variable. Below is an example of such element.


<Chain>
<MsiPackage SourceFile="Awesome1.msi">
<MsiProperty Name="InstallLocation" Value="[InstallerPath]" />
</MsiPackage>
</Chain>

Inside the MSI package’s setup project, add the directory ID to be “InstallLocation” and have it defined as a property as shown below.

<Property id="InstallLocation"/>

<Directory Id="TARGETDIR" name="SourceDir">

<Directory Id="InstallLocation" name=""My Program">

Now back in the bundle.wxs file, add the BalExtension name space as shown below.


xmlns:bal="http://schemas.microsoft.com/wix/BalExtension";

Now declare the variable which is going to hold the install path that would be passed as a command line argument.

<Variable Name="InstallerPath" bal:Overridable="yes"/>

overridable should be set to yes for all the variables that would get their values from command line arguments. Now just run the EXE passing the value.


BootstrapperSetup.exe /i InstallerPath=G:\

That’s all folks! now you have a bootstrap installer that takes the install path as a command line argument!


Burn Bootstrapper installer major upgrade doesn’t uninstall previous version

This post provides the solution for one of the worst nightmares I’ve ever had! I created this burn bootstrapper installer setup which installs and uninstall properly. But behaves abnormally during a major upgrade. That is, when you perform a major upgrade, the previous installed version wouldn’t uninstall and the new version will be installed side by side. If this was your issue, then you’re at the right place!

First of all make sure you’ve done the major upgrade the way it is expected to be done. If you have miss any of the following steps, then take a deep breath and just do it!

  • Change the product element’s ID attribute to a new GUID
  • Increment the product element’s version attribute
  •  Add and configure a major upgrade element. Which would look like,


<MajorUpgrade DowngradeErrorMessage="A newer version of [ProductName] is already installed"

But in my case, I had done all this and I still was facing the issue. Wasted a lot of time on this as I couldn’t find an answer for this in any blogs or stackoverflow questions. I turned to my installer logs and this is what I found there.

[0980:3888][2016-04-22T16:49:19]i100: Detect begin, 2 packages
[0980:3888][2016-04-22T16:49:19]i102: Detected related bundle: {f57e276b-2b99-4f55-9566-88f47c0a065c}, type: Upgrade, scope: PerMachine, version: 1.0.1.0, operation: None
[0980:3888][2016-04-22T16:49:19]i103: Detected related package: {8C442A83-F559-488C-8CC4-21B1626F4B8E}, scope: PerMachine, version: 1.0.1.0, language: 0 operation: Downgrade
[0980:3888][2016-04-22T16:49:19]i103: Detected related package: {8201DD23-40A5-418B-B016-4D29BE6F010B}, scope: PerMachine, version: 1.0.1.0, language: 0 operation: Downgrade
[0980:3888][2016-04-22T16:49:19]i101: Detected package: KubeUpdaterServiceInstallerId, state: Obsolete, cached: Complete
[0980:3888][2016-04-22T16:49:19]i101: Detected package: MosquittoInstallerId, state: Obsolete, cached: Complete
[0980:3888][2016-04-22T16:49:19]i199: Detect complete, result: 0x0
[0980:3888][2016-04-22T16:51:43]i500: Shutting down, exit code: 0x0

As you can see, it just stopped at the detect complete state. It was supposed to begin the planning phase but it didn’t! I wasted a lot of time in find a solution and in the end arrived at one!

There is this method called “DetectComplete” which is called at the end of the detect phase. So I hooked onto that method and called the plan phase manually. Now the upgrade function works like a charm! it smoothly installs the new version while removing any previous contents! So below is the implementation of it.


void DetectComplete(object sender, DetectCompleteEventArgs e)
{
Bootstrapper.Engine.Log(LogLevel.Verbose,&quot;fired! but does that give you any clue?! idiot!&quot;);
if (LaunchAction.Uninstall == Bootstrapper.Command.Action)
{
Bootstrapper.Engine.Log(LogLevel.Verbose, &quot;Invoking automatic plan for uninstall&quot;);
Bootstrapper.Engine.Plan(LaunchAction.Uninstall);
}
}

Hope this helps someone else looking for a solution for this same issue!